Your routing engine is only as good as your coordinates

Route optimization gets most of the attention in last-mile logistics. The tooling has become genuinely sophisticated.
The input data has not received the same scrutiny.
A routing engine optimizes the problem it is given. When coordinates are off - resolved to the wrong street, the wrong side of a building, or a town center instead of a specific address - the engine is still mathematically correct. It just optimizes the wrong problem. We ran the numbers on what that costs: up to €18,966/month in avoidable driver time, against €165 in geocoding API calls to avoid it.
The setup
We used the same 10,000 French addresses from our geocoding benchmark (DPE database, stratified by density zone). For each address, we had two sets of coordinates: BAN results and Google results.
Two categories matter here: degraded stops (low BAN score) and risky stops (degraded + gap > 100m). The second is the operational problem. The first is the signal that predicts it.
Degraded addresses: BAN confidence score below 0.7. In our benchmark, 20–40% of these show a coordinate gap above 100 metres - the threshold above which a driver can no longer reliably locate the right building. The lower the score, the higher the proportion of large divergences.
We ran the simulation on 10 routes per zone, using actual stop counts representative of each context. Each route was drawn from a geographically constrained pool - stops selected within a realistic radius around a random centroid, to reflect actual last-mile clustering rather than department-wide dispersion.
| Zone | Dept | Radius | Stops per route | Degraded stops (avg) | Risky stops (avg) |
|---|---|---|---|---|---|
| 1 — Dense urban | 92 | 8 km | 25 | 24.6 (98%) | 4.1 |
| 2 — Peri-urban | 60 | 15 km | 20 | 10.1 (51%) | 2.8 |
| 3 — Rural | 85 | 20 km | 12 | 7.0 (58%) | 4.8 |
The model
Route planning uses BAN coordinates throughout - this is the realistic scenario where an operator geocodes addresses once and builds routes on the result.
When a driver arrives at a risky stop, two things happen. First, the coordinates are off by more than 100 metres: the driver spends time searching for the right building or entrance. We model this conservatively at 3 minutes per stop. Second, once the driver locates the actual address, they need to travel from the real position to the next stop in the planned sequence - a sequence that was built around the BAN coordinates, not the real ones.
This second cost is the one that is almost never accounted for. The routing engine planned a direct path from stop A to stop B. In reality, the driver leaves stop A, travels to the actual building, makes the delivery, then drives to stop B - from the wrong starting point. The detour compounds across every risky stop in the route.
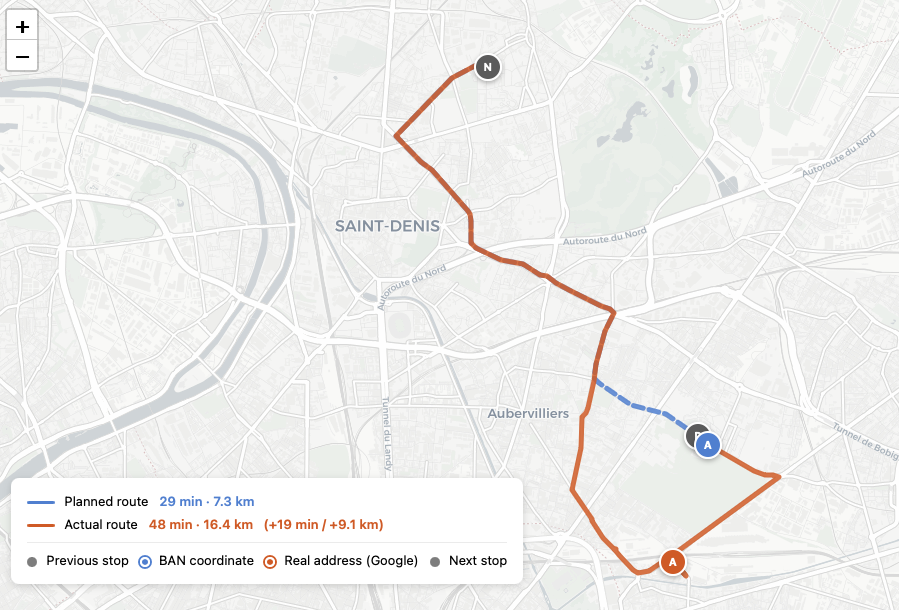
Route 9, Stop 3 - Seine-Saint-Denis (93) - BAN score 0.587 - Gap BAN vs Google: 1,542 m - Map: Leaflet · © OpenStreetMap contributors · © CARTO.
We computed this detour using road distances from OpenRouteService Directions API for each risky stop individually. Route planning used OpenRouteService Matrix API.
Results
Before the numbers: the dense urban figure (+19.7 km) is higher than other contexts in our simulations. In dense urban areas, large geocoding errors tend to resolve to a different street or neighborhood entirely - likely failed deliveries rather than recoverable detours. The peri-urban and rural figures are more representative of typical detour costs.
| Zone | Risky stops (avg) | Extra distance (median) | Extra time (median) |
|---|---|---|---|
| 1 — Dense urban | 4.1 | +19.7 km | +55.7 min |
| 2 — Peri-urban | 2.8 | +1.9 km | +10.3 min |
| 3 — Rural | 4.8 | +3.8 km | +29.1 min |
| Zone | Cost per route | Google fallback cost | ROI |
|---|---|---|---|
| 1 — Dense urban | €15.61 | €0.12 | 126x |
| 2 — Peri-urban | €5.14 | €0.08 | 65x |
| 3 — Rural | €7.94 | €0.06 | 138x |
Costs based on €17/h fully loaded driver cost (French CCN Transport 2025). Google fallback cost: €0.005/call applied to degraded stops only.
For every euro spent routing degraded addresses through a quality geocoder as fallback, between €65 and €138 in driver time is avoided. The rural zone shows the highest ROI at 138x - a combination of high degradation rate (58% of stops) and the relative cost of re-routing in areas where roads are less redundant.
A note on the dense urban zone. The urban figures should be read as a combined effect of detours and likely failed deliveries - not detours alone. For the cost of those failures, see our urban and peri-urban models.
The variance problem — and why it matters
Results vary significantly between routes in the same zone. A rural route with 7 risky stops generates +10.9 km of extra distance. Another with 0 risky stops generates nothing. This is not noise - it is the actual distribution.
The implication is that average-based cost estimates understate the tail risk. An operator running 100 routes per day will occasionally have routes that cost €20–25 in extra time due to coordinate errors alone.
Those routes are invisible in the planning system. They show up as driver delay, late deliveries, and overtime - attributed to traffic or difficulty, not to data quality.
Projection — 45,000 deliveries per month
Assuming a typical French last-mile operator with a mix of urban (40%), peri-urban (30%), and rural (20%) deliveries:
| Zone | Deliveries/month | Degraded stops | Extra km | Extra time | Cost of degradation | Fallback cost | Net saving |
|---|---|---|---|---|---|---|---|
| 1 — Dense urban | 20,000 | 19,680 | 15,526 km | 44,064 min | €12,485 | €98 | €12,386 |
| 2 — Peri-urban | 15,000 | 7,575 | 2,669 km | 13,598 min | €3,853 | €38 | €3,815 |
| 3 — Rural | 10,000 | 5,833 | 2,013 km | 9,275 min | €2,628 | €29 | €2,599 |
| Total | 45,000 | 33,088 | 20,208 km | 66,937 min | €18,966 | €165 | €18,800 |
For routing detours alone (peri-urban + rural): €6,481/month against €67 in fallback costs - a 97:1 ratio.
The urban figure (€12,485) includes large geocoding errors that likely result in failed deliveries rather than recoverable detours - bringing the total to €18,966. For the cost of those failures, see our urban and peri-urban cost models.
At scale, address quality is not a data engineering concern. It is a P&L line.
What the routing engine cannot fix
A routing engine optimizes the problem it is given. If the input coordinates are degraded, the optimization is degraded - and the optimizer has no way to know.
No amount of algorithmic sophistication changes this. A state-of-the-art solver running on wrong coordinates produces a worse result than a simple nearest-neighbor heuristic running on correct ones. The quality of the output is bounded by the quality of the input.
In French last-mile logistics, degraded geocoding costs approximately €0.60 per degraded stop in extra driver time, against a fallback cost of €0.005. The ratio holds across all three geographic contexts tested.
The fix is not a better routing engine. It is better coordinates going in.
Limitations
3-minute search penalty is a floor, not an average. The 3-minute search penalty per risky stop is deliberately conservative - the actual cost is likely higher in areas where buildings are not clearly numbered or GPS signal is unreliable.
Simulated routes, not observed ones. Routes were generated by OR-Tools on real addresses, not drawn from actual carrier data. Real routes may have different stop density, time window constraints, and geographic clustering.
Deviations modeled in isolation. In practice, a driver who arrives at the wrong location may also affect the next 2–3 stops through cascade delays - the same dynamic documented in our failed delivery cost models. We modeled only the direct detour cost, not the downstream schedule disruption.
Google as the reference. We use Google coordinates as the reference position for risky stops. Google can also be wrong - as documented in our benchmark, 0.76% of Google results were located outside France entirely. The model assumes Google is correct where BAN is degraded, which is an approximation.
Deep rural zone excluded. The deep rural zone showed insufficient risky stops per route to generate a reliable signal. The projection covers 45,000 of the assumed 50,000 monthly deliveries.
Want to fix the input, not the algorithm?
If you're working on route optimization and want to understand where coordinate quality is limiting your results, we'd be happy to talk through your setup.
Coordable builds multi-provider geocoding pipelines that automatically route degraded addresses through a quality fallback - so your routing engine gets the right coordinates from the start. Get in touch to run the numbers on your own operation.
Methodology
Dataset: 10,000 French addresses from the ADEME DPE database (existing residential buildings, post-July 2021). Stratified sample across four INSEE density zones. Zones tested: Dept 92 (dense urban), Dept 60 (peri-urban), Dept 85 (rural).
Geographic constraint: Each route drawn from addresses within a fixed radius of a randomly selected centroid - 8 km (urban), 15 km (peri-urban), 20 km (rural). Routes with geographic span exceeding 2× the radius were discarded.
Route simulation: OR-Tools (Google) with PATH_CHEAPEST_ARC + GUIDED_LOCAL_SEARCH, 10-second time limit per route. Route planning distances from OpenRouteService Matrix API (driving-car profile). Depot set to centroid of each route's stops.
Degraded stops: BAN confidence score < 0.7. Validated as predictive of significant coordinate divergence in benchmark analysis.
Risky stops: Degraded stops where BAN↔Google Haversine distance ≥ 100m.
Deviation cost: For each risky stop, extra distance = road_distance(BAN → Google) + road_distance(Google → next_BAN) − road_distance(BAN → next_BAN). Road distances from OpenRouteService Directions API. Fallback to Haversine × 1.3 when ORS unavailable. Time cost = extra travel time + 3 min on-site search per risky stop.
Driver cost: €17/h fully loaded (French CCN Transport routier, 2025, including employer social charges at ~30%).
Google fallback cost: €0.005/call (Google Geocoding API standard pricing), applied only to degraded stops.
Projection figures: Based on medians. Extrapolated linearly from simulated routes.
Note on geocoding cost estimates
Geocoding pipeline cost - Estimated using BAN (free, open source) as primary geocoder, with a premium provider (Google Geocoding API, ~€0.005/address) triggered only on addresses where BAN confidence score falls below 0.7 - roughly 15-20% of a typical French address file. This cascading approach is the architecture Coordable is built around: coordable.co.