How to reduce geocoding costs by 67%
The use case: a logistics company paying way too much for geocoding
If you work in logistics, insurance, or routing software, you know the drill: geocoding volumes are massive, and the bills that come with them are too.
In this article, we show how Coordable helped a logistics company cut geocoding costs by 67% while also increasing its share of valid geocoding results from 94% to 97.7%. Total savings: $20,280 per year. 🤩
Let's dive in.
Table of contents:
The problem: choosing between cost and quality
You have probably faced this tradeoff: premium providers like Google Maps deliver excellent results, but they come at a price. Cheaper alternatives may leave some addresses unresolved.
Most of the time, though, you do not actually need the premium option; addresses are clean and unambiguous, so any decent geocoder will do the job. The real challenge appears when your address data is messy: in those cases, you are forced to choose between paying for Google Maps to guarantee correct results, or accepting that a cheaper provider will miss some.
The solution: cascading providers
Good news: there is a strategy that gives you the best of both worlds, cascading geocoders. The principle is straightforward:
- Use an open-source or low-cost provider for ~90% of geocoding requests (the clean, unambiguous addresses).
- Use a premium geocoder (or several) to resolve the remaining ~10%.
This approach raises geocoding success rates while keeping costs down. In our case, it reduced costs by 67% and increased the share of successfully geocoded addresses by +3.7%. Here is how we did it.
The workflow: 3 providers
Our logistics client needed to geocode mostly residential addresses in France. France has an excellent government API for this purpose, the Base Adresse Nationale (BAN), which covers French residential addresses very well, though it does not handle points of interest or addresses outside France. Many commercial providers actually use BAN data to improve their own results.
The downside of BAN's API is that it is less robust at parsing and matching poorly formatted input. So we still needed to pair it with at least one commercial provider to ensure no addresses slip through. For that, we chose Google Maps. Finally, we added HERE as a second fallback because HERE also leverages BAN data, making it a strong option for the French addresses that Google could not resolve to rooftop level.
Here is our strategy:
- French BAN: confidence score > 0.75 required.
-
Google Maps API:
ROOFTOPlocation type required (if not resolved in step 1). - HERE: confidence score > 0.75 required (if not resolved in step 2).
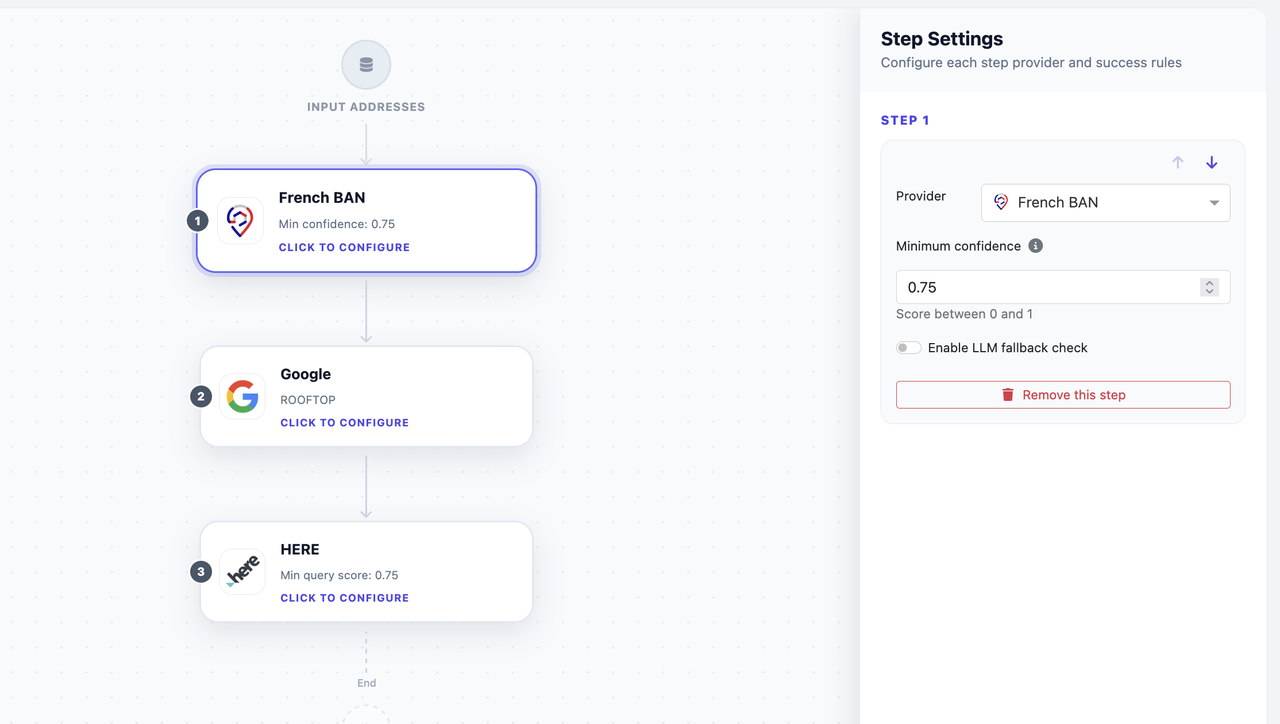
We apply quality rules at each step to discard results that are not good enough. For French BAN and HERE, the confidence score reflects how closely the geocoder matched the input string. Although computed slightly differently across providers, both scores are a reliable way to filter out poor results. Setting the threshold at 0.75 is fairly strict, but the cascade makes this safe; any address rejected at one step simply moves to the next provider.
Google Maps does not provide a confidence score, so instead we filter on the location type returned (ROOFTOP, APPROXIMATE, GEOMETRIC_CENTER). For residential addresses, we require ROOFTOP only, to ensure the coordinates are placed in front of the building rather than somewhere in the middle of the street.
The results
To measure the impact, we ran two geocoding sessions on the same dataset and compared them:
- Google Maps only: the client's initial setup.
- Cascading strategy: BAN → Google Maps → HERE.
The test dataset contains 1,000 residential addresses, mostly clean and well-formed. That is large enough to get a reliable picture of how this strategy performs at scale.
In practice, the client geocodes about 500,000 addresses per month.
Session 1: Google Maps only
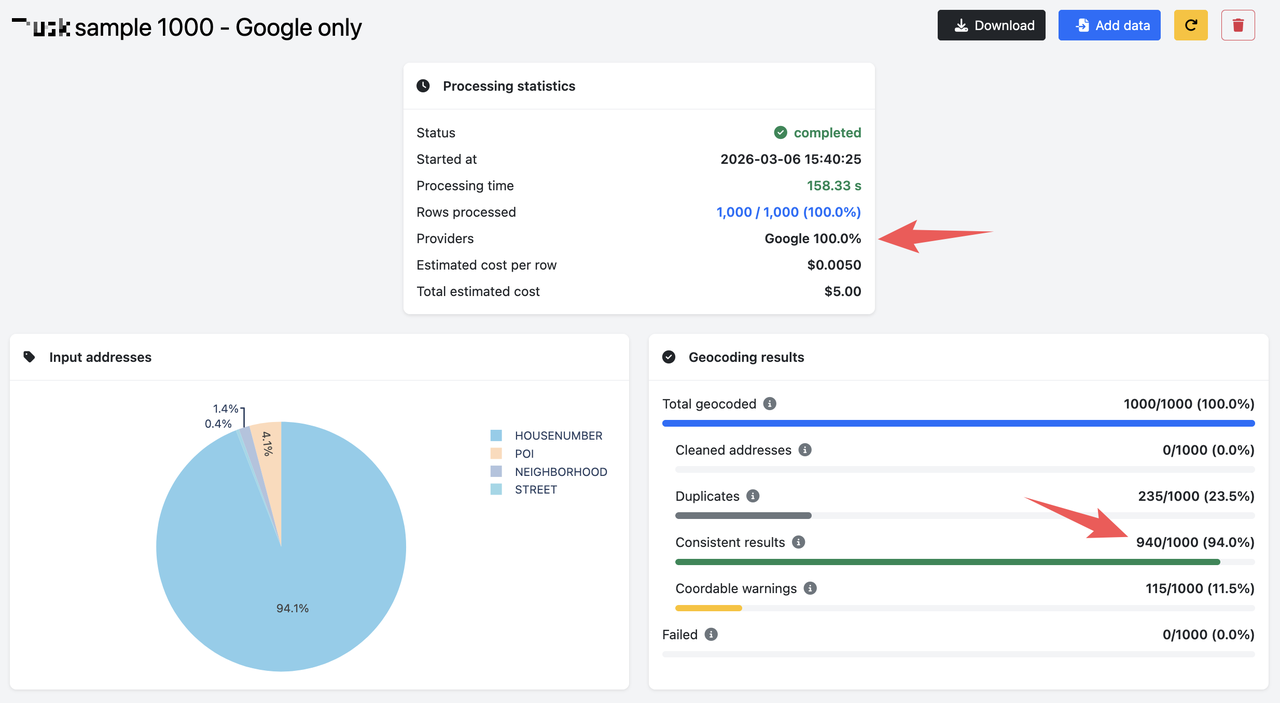
Results:
-
94% valid geocoding results (addresses resolved to
ROOFTOP). - Estimated cost: $5.00 per 1,000 addresses.
Note: these costs ignore the Google free quota, which is shared across all Google Maps products. Its effective value depends on each client's overall usage, so we exclude it for a fair comparison.
Session 2: BAN + Google Maps + HERE (cascading)
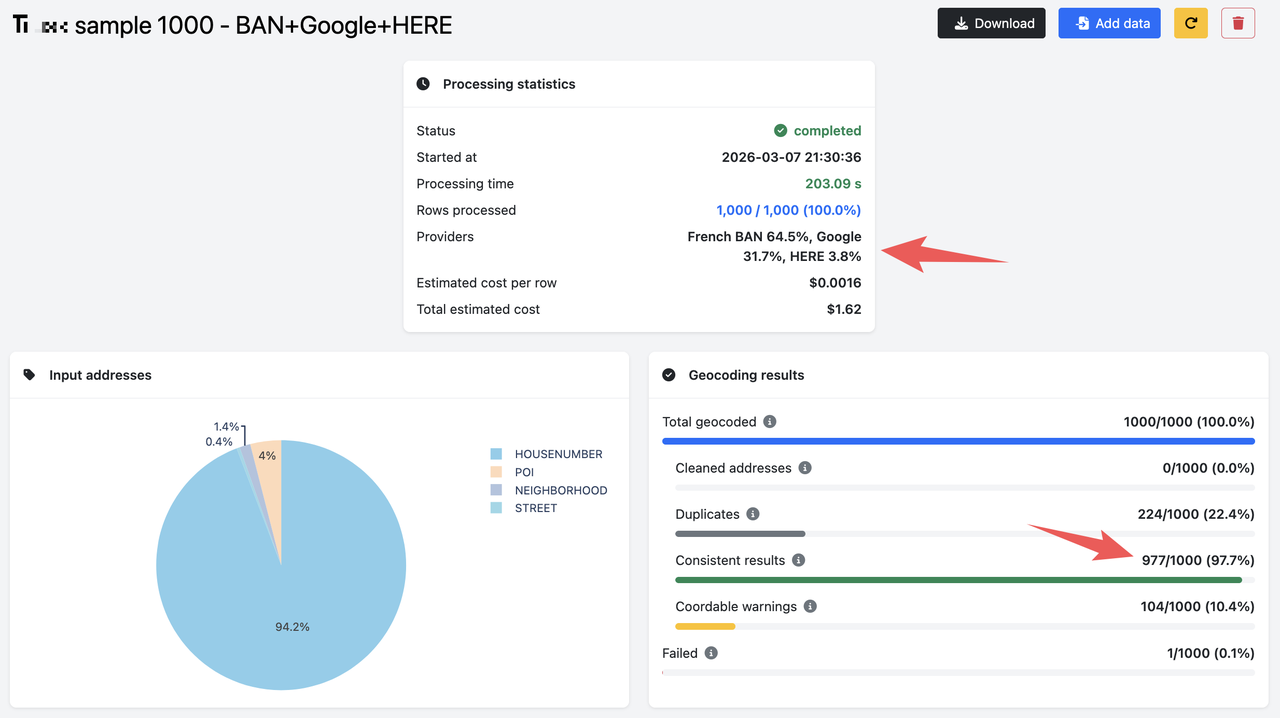
Results:
- 97.7% valid geocoding results, a +3.7% improvement.
- Estimated cost: $1.62 per 1,000 addresses.
Provider breakdown: BAN 64.5% · Google Maps 31.7% · HERE 3.8%
Using BAN means that 64.5% of addresses cost nothing to geocode. Our strict rules then sent 31.7% of addresses to Google Maps, and HERE handled the remaining 3.8%.
Total cost reduction: 67%, while improving geocoding quality.
Yearly cost savings
At 500,000 addresses per month, the client was spending about $2,500/month on Google Maps alone. With the cascading strategy, that bill drops to $810/month, without any loss of quality; on the contrary.
| Monthly cost | Annual cost | |
|---|---|---|
| Google Maps only | $2,500 | $30,000 |
| Cascading (BAN + Google + HERE) | $810 | $9,720 |
| Savings | $1,690 | $20,280 |
That is $20,280 saved per year, while resolving +3.7% more addresses correctly.
Conclusion
If you are paying Google Maps rates for every address, you are likely overpaying. This real-world example shows how large the gap can be: by routing the bulk of clean French addresses through the free BAN API, reserving Google Maps for harder cases, and using HERE as a final safety net, the client went from 94% to 97.7% geocoding success while paying 67% less.
The key is combining the right providers in the right order, and enforcing quality rules at each step so only genuinely good results pass through. The result is a system that is both cheaper and more reliable than relying on a single provider.
Set up cascading geocoding with Coordable
Where to go from here
- Learn more about the providers used in this workflow: Google Maps Geocoding API, HERE Geocoding API.
- See how providers compare in France: Best geocoding providers for France.
- Compare Google and HERE head-to-head: Google vs HERE for geocoding.
- See current geocoding prices at a glance: Geocoding prices in 2026.